
www.rabbitcalls.com+91 8140501868support@rabbitcalls.com
Analytics
Call volume, answer rate, duration, outcomes, and per-agent performance for a selected date range.
Module guide
Analytics
Call volume, answer rate, duration, outcomes, and per-agent performance for a selected date range.
Purpose
Analytics is the reporting layer above Dashboard and Call logs. Use it to spot volume trends, compare inbound vs outbound, see outcomes, and rank agent performance over a chosen period.
What you see
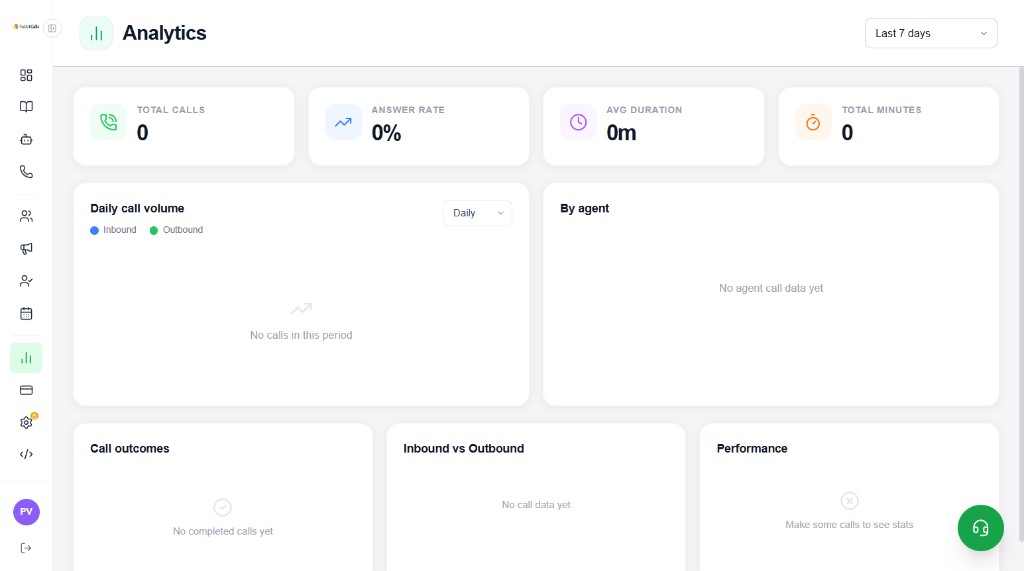
Pick a date range (e.g. Last 7 days) in the header. KPI cards and charts fill in as calls complete.
- Total Calls — volume in the selected period
- Answer Rate — share of calls that connected
- Avg Duration — average talk time
- Total Minutes — billable / talked minutes
- Daily Call Volume — inbound (blue) vs outbound (green); Daily (or other) grain
- By Agent — per-agent call performance
- Call Outcomes — completed / other outcome breakdown
- Inbound vs Outbound — mix of directions
- Performance — summary when enough call data exists
Tip: Empty states (No calls in this period / Make some calls to see stats) are normal on new workspaces — place a Test call or run a Campaign first.
How to use it
- Change the date range to compare weeks or campaigns
- If answer rate is low, check Phone numbers, agent prompts, and hangup patterns in Call logs
- Use By Agent to compare scripts or voices after A/B changes
- Drill into Call logs for the raw recording behind a spike or drop
Tip: Pair weak outcomes with Knowledge base and Agent prompt updates when callers hang up on the same question repeatedly.